Let’s be honest: This year might be the first time you’ve attended a Super Bowl party in at least three years. And with Super Bowl LVII, slated for Feb. 12 at State Farm Stadium in Glendale, Ariz., just around the corner, it’s time to brush up on some fun food and spending statistics that could very well make you the life of the party.
Here’s a rundown of what you really need to know prior to the big game, when the Eagles take on the Chiefs for the biggest event in sports.
• 8,726: Estimated cost, in dollars, of one Super Bowl game ticket, three nights in a hotel, four days’ worth of meals and drinks, roundtrip airfare and car rental for four days in the Glendale area (Forbes.com)
• 6,214: Average price of a ticket, in dollars, to the previous five Super Bowls (NorthBayBiz.com)
• 2: Rank of Super Bowl Sunday among the largest food “holidays” in the United States, behind only Thanksgiving (PremioFoods.com)
• 79: Percentage of food and beverage purchases made in advance of the game; team apparel is a distant second at 11%, followed by TVs, decorations and furniture (NRF.com)
 • 14.6 billion: Total anticipated spending, in dollars, by Super Bowl viewers in 2022 (NRF.com)
• 17.2 billion: Total anticipated spending, in dollars, by Super Bowl viewers in 2020 (NRF.com)
• 8.9 billion: Total anticipated spending, in dollars, by Super Bowl viewers in 2010 (NRF.com)
• 79.82: Average amount, in dollars, each person watching the Super Bowl is expected to spend in 2022 (NRF.com)
• 88.65: Average expected spending, in dollars of each person watching the Super Bowl in 2020 (NRF.com)
• 52.63: Average expected spending, in dollars of each person watching the Super Bowl in 2010 (NRF.com)
• 0: Amount, in dollars, Super Bowl Halftime Show performers receive as an appearance fee (NorthBayBiz.com)
• 48 million: Number of Americans who order take out on Super Bowl Sunday; 60% of those orders are pizza (Restaurantware.com)
• 14 billion: Number of burgers grilled over Super Bowl Weekend, which is the second biggest week for grilling after the Fourth of July (PremioFoods.com)
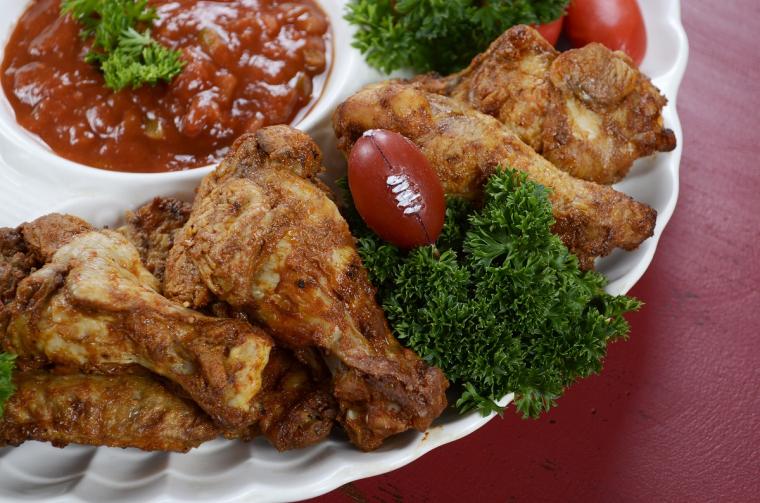
• 1.2 billion: Number of chicken wings consumed by humans on Super Bowl Weekend, accounting for 7% of annual chicken wing sales (Restaurantware.com)
• 1.2 million: Pounds of potato chips crunched on Super Bowl Sunday; 8.2 million pounds of tortilla chips and 4 million pounds of pretzels are eaten, too (PremioFoods.com)
• 45: Number of football fields you would need to run in order to burn off the calories contained in two handfuls of potato chips (yeah, thanks to the SeattleTimes.com for that incredibly depressing statistic)
• 139.4 million: Pounds of avocados purchased to make guacamole for those chips and pretzels — or to add to meals; this is the healthiest statistic we could find (Restaurantware.com)
• 325.5 million: Gallons of beer consumed during Super Bowl Weekend; that equates to 50 million cases (Restaurantware.com)
• 90: Percent increase in beer consumed on Super Bowl Sunday than on an average day (NorthBayBiz.com)
• 20: Estimated percent increase in antacid sales the Monday after the Super Bowl; about 1.5 million people will call in sick to work that day (PremioFoods.com)

