

Since the mid-1990s, Running USA has documented the sport's historic growth, designated this time period as the Second Running Boom and commented on the reasons why: training programs; family-centered community events; new, fun, cool, hip events and running series; improved race management; Title IX ripple effect tied to women's growth; technology and access to information via websites and social media.
Over the past 20 years, every year, except 2003, set a new high in the number of finishers in U.S. running events, and 2012 continued the upward trend with a record of more than 15.5 million finishers. The snapshot below presents an overview of record-setting year by the numbers.
2012 U.S. Running Snapshot:
Females account for 8.6 million finishers nationwide (a record number) and represent the highest percentage ever reported of 56% of event fields. Males in 2012 also set a new high with more than 6.8 million finishers in U.S. races. Overall, there were 15,534,000 finishers in U.S. running events.
The number of U.S. race finishers has increased 80% since the year 2000, and female representation has increased from only 42% to an all-time high of 56% in 2012.
Total number of U.S. running events reached 26,370, another all-time high.
The half-marathon continues to fuel the growth of the Second Running Boom with an annual increase of 14.9% finishers (1.85 million) and an astounding 60% female participation.
In 2012, the 5K maintained the #1 position of all race distances with 6.2 million finishers (another record number), claiming nearly 40% of all finishers in the U.S., while the half-marathon again held the #2 position with approximately 12% of the finishers, followed by the 10K (9.5%).
Mud runs, obstacle runs and color runs have grown exponentially in the past few years, and it is estimated that approximately 2 million runners participated in these non-traditional, adventure-type races last year.
The following lists, charts and tables provide an overall summary of U.S. races, including demographics.
TABLE 1: U.S. Race Finishers 1990-2012
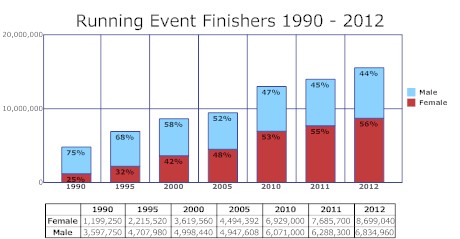
TABLE 2: Finishers in 2012 U.S. Running Events | |||
Distance | 2012 Totals | % of Total | ‘11 – ‘12 Change |
5K | 6,200,000 | 39.9% | 17.5% |
Half-Marathon | 1,850,000 | 11.9% | 14.9% |
10K | 1,470,000 | 9.5% | 4.% |
Marathon | 487,000 | 3.1% | -6.0%* |
Others | 5,527,000 | 35.6% | 7.2% |
TOTAL | 15,534,000 |
| 11.2% |
*Decrease due to the ING New York Marathon cancellation
TABLE 3: Number of 2012 U.S. Running Events |
| ||
Distance | # of Events | % of Total |
|
5K | 15,000 | 57% |
|
10K | 3,200 | 12% |
|
Half-Marathon | 1,900 | 7% |
|
8K/5mile | 1,020 | 4% |
|
Marathon | 850 | 3% |
|
Others | 4,400 | 17% |
|
TOTAL | 26,370 |
|
|
SOURCE: Running USA powered by Athlinks
Road Race Demographics
The sweet spot of running event participation falls between the ages of 25 and 44 for both genders (58% for women and 50% for men), and overall last year, 54% of all finishers came from between said age bookends.
TABLE 4: Age Group Distribution of U.S. Timed Race Finishers 2012 | ||||
Age Group | Female | Male | Overall |
|
6-17 yrs | 8% | 11% | 10% |
|
18-24 yrs | 11% | 8% | 9% |
|
25-34 yrs | 31% | 25% | 28% |
|
35-44 yrs | 27% | 25% | 26% |
|
45-54 yrs | 16% | 19% | 18% |
|
55-64 yrs | 6% | 9% | 7% |
|
65+ yrs | 1% | 3% | 2% |
|
SOURCE: Running USA powered by Athlinks
TABLE 5: Average Age of Timed Race Finishers | |
| 2012 |
Timed Road Race Finishers | 35.8 |
Female Timed Road Race Finishers | 34.4 |
Male Timed Road Race Finishers | 37.1 |
SOURCE: Running USA powered by Athlinks
Per the below, gender distribution, median times and average age are reported for the 5K, 10K, Half-Marathon and Marathon in 2012.
TABLE 6: Race Demographics of Timed Finishers in 2012
| WOMEN | MEN |
5K | 58% | 42% |
Median Time | 34:34 | 28:31 |
Average Age | 32.8 | 33.6 |
10K | 55% | 45% |
Median Time | 1:04:37 | 55:52 |
Average Age | 35.2 | 37.7 |
Half-Marathon | 60% | 40% |
Median Time | 2:19:47 | 2:01:28 |
Average Age | 35.6 | 38.5 |
Marathon | 42% | 58% |
Median Time | 4:42:58 | 4:17:43 |
Average Age | 36.2 | 39.8 |
SOURCE: Running USA powered by Athlinks
Mud, Obstacles and Beer
From couch potatoes to novice runners to extreme athletes, there is a recent trend that has been sweeping the nation. In fact, the success of these non-traditional running events is so explosive that it cannot be ignored by the running industry. Across the country, mud and obstacle runs are attracting a niche market of people who want to be active, but not necessarily competitive; many just want to have fun, enjoy the camaraderie of others and focus more on the social, team-building aspect than competition.
The accomplishing something fun together has a strong appeal as evidenced by the rapid growth of such non-traditional events since 2009. Plus, while people might love to run, they also love running in costumes and being silly and later celebrating with live music and beer afterwards. These events offer a unique twist to classic road races by providing participants a greater sense of satisfaction and reward with a story to share with friends and photos to post on social media sites such as Facebook, Twitter and Instagram.
Tough Mudder, Warrior Dash and Spartan Race participants pay upwards of $50-$200 to jump over fire, crawl through the mud and under barbed wire, jump off platforms into ice cold water, and even experience an electric shock, all without hesitating to sign a liability waiver. There were more than an estimated 2 million participants in mud and obstacle runs last year. The Warrior Dash alone has grown from 120,000 participants in 2010 to more than 550,000 in 2012, an astounding 358% increase in a few short years. It is projected that there will be over 600,000 participants in the Warrior Dash for 2013 making this the World's Largest Obstacle Race Series. In 2012 there were approximately 50 Warrior Dash events worldwide, including locations across the U.S., Europe, Asia and Australia.
Warrior Dash, who partners with St. Jude Children's Research Hospital, also raised more than $4.4 million in 2012 and donated more than 700,000 pounds of used sneakers last year as part of the Green Sneakers program, while Tough Mudder and the Wounded Warrior Project together have raised more than $5 million to-date.
An Explosion of Color
Now the single largest 5K event series in the nation, The Color Run is known as the "Happiest 5K on the Planet" with the goals of celebrating healthiness, happiness, individuality and giving back to the community. Since its debut in 2012, there are now 100-plus events with participant totals expected to reach one million in 2013. More than 60% of Color Runners are first-time 5Kers that are celebrating healthy living and wellness all in a rainbow of color. With the success of The Color Run, there are now similar themed series such as Run or Dye and Color Me Rad popping up around the country.
Is this a colorful fad, like the popularity of tie-dye shirts, destined to fade away in time, or is this one here to stay? Regardless, non-traditional events such as The Color Run, Foam Fest and Mud and Obstacle events such as Warrior Dash and Tough Mudder are surely drawing in the crowds and attracting new participants to the sport; millions who would have gone unreached via the traditional road race route. The question is: Will these runners be "one and done" participants? Will they only stick to the non-traditional race series or might they consider entering a more traditional race event at some point? Only time will tell, but this new category of the sport has reached a new subset of people and added to the Second Running Boom numbers.
The next Running USA State of the Sport report will feature the largest race lists nationwide for 2012, including Top 100 Timed, World's Largest, Largest Festivals, Largest by State, Largest Women's and Largest Youth Runs.
SOURCE:
Running USA = Running USA advances the growth and success of the running industry. State of the Sport reports, many types of running data and lists of the largest races from past years can be found on RunningUSA.org in the "Statistics" section. For other questions about running trends and demographics, contact ryan@runningusa.org or tracy@runningusa.org
There are no comments
Please login to post comments