

If the sold-out NYC Marathon had been held, there is no doubt that the 2012 overall marathon finisher total would have exceeded the 2011 record of 518,000. In addition, overall, there was a 1.6% increase in finishers from the same 388 U.S. marathons for 2011 and 2012 (464,122 vs. 471,595); a slight percent increase (1%) from the same 367 marathons in 2010 and 2011 (495,135 vs. 500,206).
Over the past 15 years, U.S. marathons collectively have averaged just under 2.5% finisher growth per year so although 2012's growth rate of 1.6% for the same marathons for both years was below the annual average, it was not a significant decline. In short, it is premature, at this time, to say that U.S. marathon growth has lost its bloom, and also, some of the marathon's smaller overall finisher percent growth over the past two years can be attributed to the popularity of the half-marathon, the fastest growing road race distance in America since 2003 (and 2012 was another record finisher year for the 13.1 mile).
The following tables and lists represent a summary of the demographics and stats and trends for U.S. marathons and worldwide rankings. Per the tables below, U.S. marathon demographics - gender, age group, median age and median time - have remained essentially the same in recent years.
Gender and Age Group Breakdown |
|
|
|
|
|
|
| ||
| 1980 | 2006 | 2007 | 2008 | 2009 | 2010 | 2011 | 2012 |
|
Women | 11% | 40% | 40% | 41% | 41% | 41% | 41% | 42% |
|
Men | 90% | 60% | 60% | 59% | 59% | 59% | 59% | 58% |
|
Masters (40 yrs+) | 26% | 46% | 46% | 45% | 46% | 46% | 46% | 46% |
|
Open (20 to 39 yrs) | 69% | 52% | 52% | 53% | 52% | 52% | 52% | 52% |
|
Juniors (under 20) | 5% | 2% | 2% | 2% | 2% | 2% | 2% | 2% |
|
|
|
|
|
|
|
|
|
|
|
| Female | Male |
|
|
|
|
|
|
|
6-17 yrs | 1% | 1% |
|
|
|
|
|
|
|
18-24 yrs | 10% | 7% |
|
|
|
|
|
|
|
25-34 yrs | 35% | 26% |
|
|
|
|
|
|
|
35-44 yrs | 31% | 31% |
|
|
|
|
|
|
|
45-54 yrs | 17% | 23% |
|
|
|
|
|
|
|
55-64 yrs | 5% | 10% |
|
|
|
|
|
|
|
65+ yrs | 1% | 2% |
|
|
|
|
|
|
|
|
|
|
|
|
|
|
|
|
|
Median Age |
|
|
|
|
|
| |||
| 1980 | 2006 | 2007 | 2008 | 2009 | 2010 | 2011 | 2012 | (Mean) |
Males | 34 | 40 | 40 | 39 | 40 | 40 | 40 | 40 | (39.8 yrs) |
Females | 31 | 35 | 36 | 35 | 35 | 35 | 35 | 35 | (36.2 yrs) |
Median Age Overall |
| 38 | 38 | 38 | 36 | 37 | 37 | 37 | (38.3 yrs) |
|
|
|
|
|
|
|
|
|
|
Median Times - U.S. Marathon Finishers |
|
|
|
|
|
|
| ||
| 1980 | 2006 | 2007 | 2008 | 2009 | 2010 | 2011 | 2012 |
|
Males | 3:32:17 | 4:19:31 | 4:20:04 | 4:20:04 | 4:13:54 | 4:16:14 | 4:16:34 | 4:17:43 |
|
Females | 4:03:39 | 4:49:57 | 4:49:48 | 4:43:31 | 4:41:29 | 4:42:10 | 4:42:15 | 4:42:58 |
|
Year Estimated U.S. Marathon Finisher Total
1976 | 25,000 |
|
1980 | 143,000 |
|
1990 | 224,000 |
|
1995 | 293,000 |
|
2000 | 353,000 |
|
2004 | 386,000 |
|
2005 | 395,000 |
|
2006 | 410,000 |
|
2007 | 412,000 |
|
2008 | 425,000 |
|
2009 | 467,000 |
|
2010 | 507,000 |
|
2011 | 518,000 | (all-time high) |
2012 | 487,000 |
|
National Runner Survey
In 2012, Running USA surveyed more than 30,000 core runners nationwide, and those respondents who had completed a marathon in the last two years ran approximately 4.3 days per week for an average of 28.3 miles. They also purchased approximately 3.5 pairs of running shoes and 77.5% had spent $100 or more on running apparel in the last 12 months.
U.S. marathons with more than 1,000 finishers and number of U.S. marathons set new records
Last year, there were a record 95 U.S. marathons reporting greater than 1,000 finishers, compared with 94 in 2011, the previous record. Since 1999, the number of U.S. marathons with more than 1,000 finishers in a single year has increased 111% (45 in 1999 vs. 95 in 2012).
For the first time since 1996, there was no inaugural U.S. marathon with more than 1,000 finishers, and overall, there were at least 20 debut marathons in this country and most of them were small (less than 300 finishers).
In 2012, there were an estimated 850 U.S. marathons, a record high, compared to approximately 300 marathons in 2000.
2012 U.S. Marathons (>1,000 finishers) with the… |
|
|
| ||
|
|
|
|
|
|
… Fastest Median Times |
|
|
|
|
|
| 2008 | 2009 | 2010 | 2011 | 2012 |
Baystate |
| 3:48:42 | 3:47:42 |
| 3:53:44 |
Eugene |
|
|
| 3:59:17 | 4:00:15 |
Steamtown | 3:56:13 | 3:55:48 | 3:55:41 | 4:05:27 | 4:00:40 |
COX Rhode Races |
|
|
|
| 4:00:57 |
Harrisburg |
|
|
|
| 4:02:57 |
|
|
|
|
|
|
… Slowest Median Times |
|
|
|
|
|
| 2008 | 2009 | 2010 | 2011 | 2012 |
Bataan Memorial March | 7:47:50 | 7:37:50 | 7:29:29 | 7:27:31 | 7:44:14 |
Honolulu | 5:49:00 | 5:44:46 | 5:50:52 | 5:46:35 | 5:52:47 |
Honda LA | 5:31:57 | 5:23:30 | 5:17:29 | 5:06:41 | 5:06:20 |
Nike Women’s |
| 5:10:39 | 4:59:35 | 5:04:47 | 5:03:10 |
Walt Disney World |
|
| 5:08:39 |
| 5:02:44 |
|
|
|
|
|
|
… Most <4 Hour Finishers |
|
|
|
|
|
| 2008 | 2009 | 2010 | 2011 | 2012 |
Bank of America Chicago | 6,382 (21%) | 11,226 (33%) | 8,294 (23%) | 8,743 (24%) | 11,717 (31%) |
Boston | 14,547 (66%) | 15,691 (69%) | 15,424 (68%) | 16,211 (68%) | 8,644 (40%) |
Philadelphia | 3,193 (44%) | 3,221 (46%) | 3,891 (43%) | 4,046 (39%) | 4,927 (42%) |
Marine Corps |
| 4,771 (22%) | 4,622 (21%) | 4,565 (22%) | 4,501 (19%) |
Twin Cities |
|
|
|
| 3,344 (38%) |
|
|
|
|
|
|
… Most >6 Hour Finishers |
|
|
|
|
|
| 2008 | 2009 | 2010 | 2011 | 2012 |
Honolulu | 8,761 (44%) | 7,788 (38%) | 8,155 (40%) | 7,621 (40%) | 9,342 (41%) |
Honda LA | 6,420 (37%) | 4,373 (31%) | 6,313 (28%) | 5,069 (26%) | 4,630 (25%) |
Walt Disney World | 3,217 (25%) | 3,165 (21%) | 4,044 (24%) | 2,761 (20%) | 2,986 (22%) |
Bank of America Chicago |
|
| 3,465 (10%) | 2,936 (8%) | 2,507 (7%) |
Marine Corps |
|
|
|
| 1,994 (8%) |
… Most Finishers by Age Groups |
| |
| Event | 2012 Subtotals |
Female Juniors | Honolulu | 1,272 |
Male Juniors | Honda LA | 1,488 |
Females 20-29 | Bank of America Chicago | 5,125 |
Males 20-29 | Bank of America Chicago | 3,975 |
Females 30-39 | Bank of America Chicago | 5,852 |
Males 30-39 | Bank of America Chicago | 6,893 |
Females 40-49 | Bank of America Chicago | 3,947 |
Males 40-49 | Bank of America Chicago | 5,915 |
Females 50-59 | Honolulu | 1,645 |
Males 50-59 | Boston | 2,958 |
Females 60+ | Honolulu | 971 |
Males 60+ | Honolulu | 2,165 |
|
|
|
Overall 40+ | Bank of America Chicago | 15,009 |
Overall 50+ | Honolulu | 6,911 |
Overall 60+ | Honolulu | 3,136 |
… Highest Percent Women* |
|
|
| |
| 2009 | 2010 | 2011 | 2012 |
Nike Women’s | 93% | 91% | 92% | 91% |
26.2 with Donna |
| 61% |
| 62% |
Rock ‘n’ Roll Savannah |
|
| 52% | 51% |
|
|
|
|
|
… Highest Percent Men* |
|
|
|
|
| 2009 | 2010 | 2011 | 2012 |
United States Air Force | 74% | 71% | 70% | 68% |
Wipro San Francisco |
|
| 67% | 67% |
Publix Georgia |
|
|
| 66% |
|
|
|
|
|
… Highest Percent Masters (40+ yrs)* |
|
|
| |
| 2009 | 2010 | 2011 | 2012 |
Boston | 56% | 56% | 58% | 59% |
Myrtle Beach |
|
|
| 57% |
Napa Valley |
|
|
| 56% |
|
|
|
|
|
*Events with >1,000 finishers in each representative category |
| |||
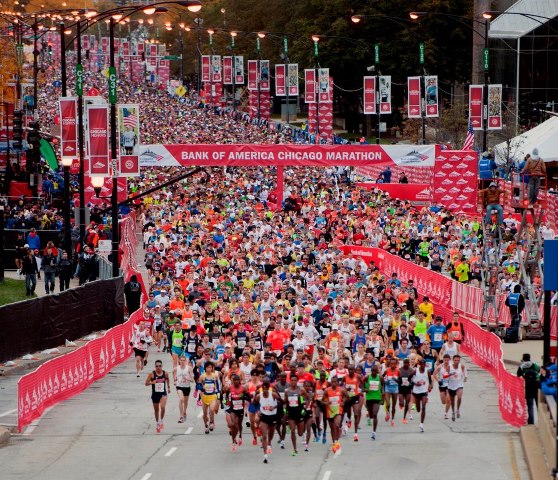
Bank of America Chicago Marathon largest in 2012; record 30 marathons had more than 10,000 finishers in 2012
With 37,475 finishers, an event record, the Bank of America Chicago Marathon was the largest 26.2 mile road race in the world last year, and it was only the second marathon ever with more than 37,000 finishers (New York City Marathon, the other, 6 times). For the first time, 30 marathons worldwide had more than 10,000 finishers. In addition, the U.S. and Japan each had 5 of the 15 largest marathons in the world. See 2012 top rankings below.
2012
World's Largest Marathons (finishers):
1 | Bank of America Chicago, IL | 37,475 |
2 | Virgin London, GBR | 36,705 |
3 | Tokyo, JPN | 34,656 |
4 | BMW Berlin, GER | 34,348 |
5 | Paris, FRA | 32,980 |
6 | Osaka, JPN | 27,157 |
7 | Honolulu, HI | 24,069 |
8 | Marine Corps, DC | 23,519 |
9 | Boston, MA | 21,616 |
10 | Zurich Barcelona, ESP | 19,198 |
11 | Honda LA, CA | 18,919 |
12 | Naha, JPN | 17,819 |
13 | Kobe, JPN | 16,818 |
14 | Ibusuki Nanohana, JPN | 15,785 |
15 | Joon Ang Seoul Int'l, KOR | 15,346 |
U.S. Largest Marathons (finishers):
1 | Bank of America Chicago, IL | 37,475 |
2 | Honolulu, HI | 24,069 |
3 | Marine Corps, DC | 23,519 |
4 | Boston, MA | 21,616 |
5 | Honda LA, CA | 18,919 |
6 | Walt Disney World, FL | 13,524 |
7 | Philadelphia, PA | 11,635 |
8 | Medtronic Twin Cities, MN | 8,783 |
9 | Chevron Houston, TX | 7,614 |
10 | Rock 'n' Roll San Diego, CA | 7,106 |
11 | Portland, OR | 6,518 |
12 | California International, CA | 6,511 |
13 | Wipro San Francisco, CA | 6,494 |
14 | Grandma's, MN | 5,788 |
15 | St. George, UT | 5,721 |
SOURCE: Running USA with Athlinks (2009-12) and Active.com (2005-08); Contact: Ryan Lamppa at (805) 966-7747or ryan@runningusa.org.
There are no comments
Please login to post comments